Community, Connection, and Inequality: Rethinking Ageing in England
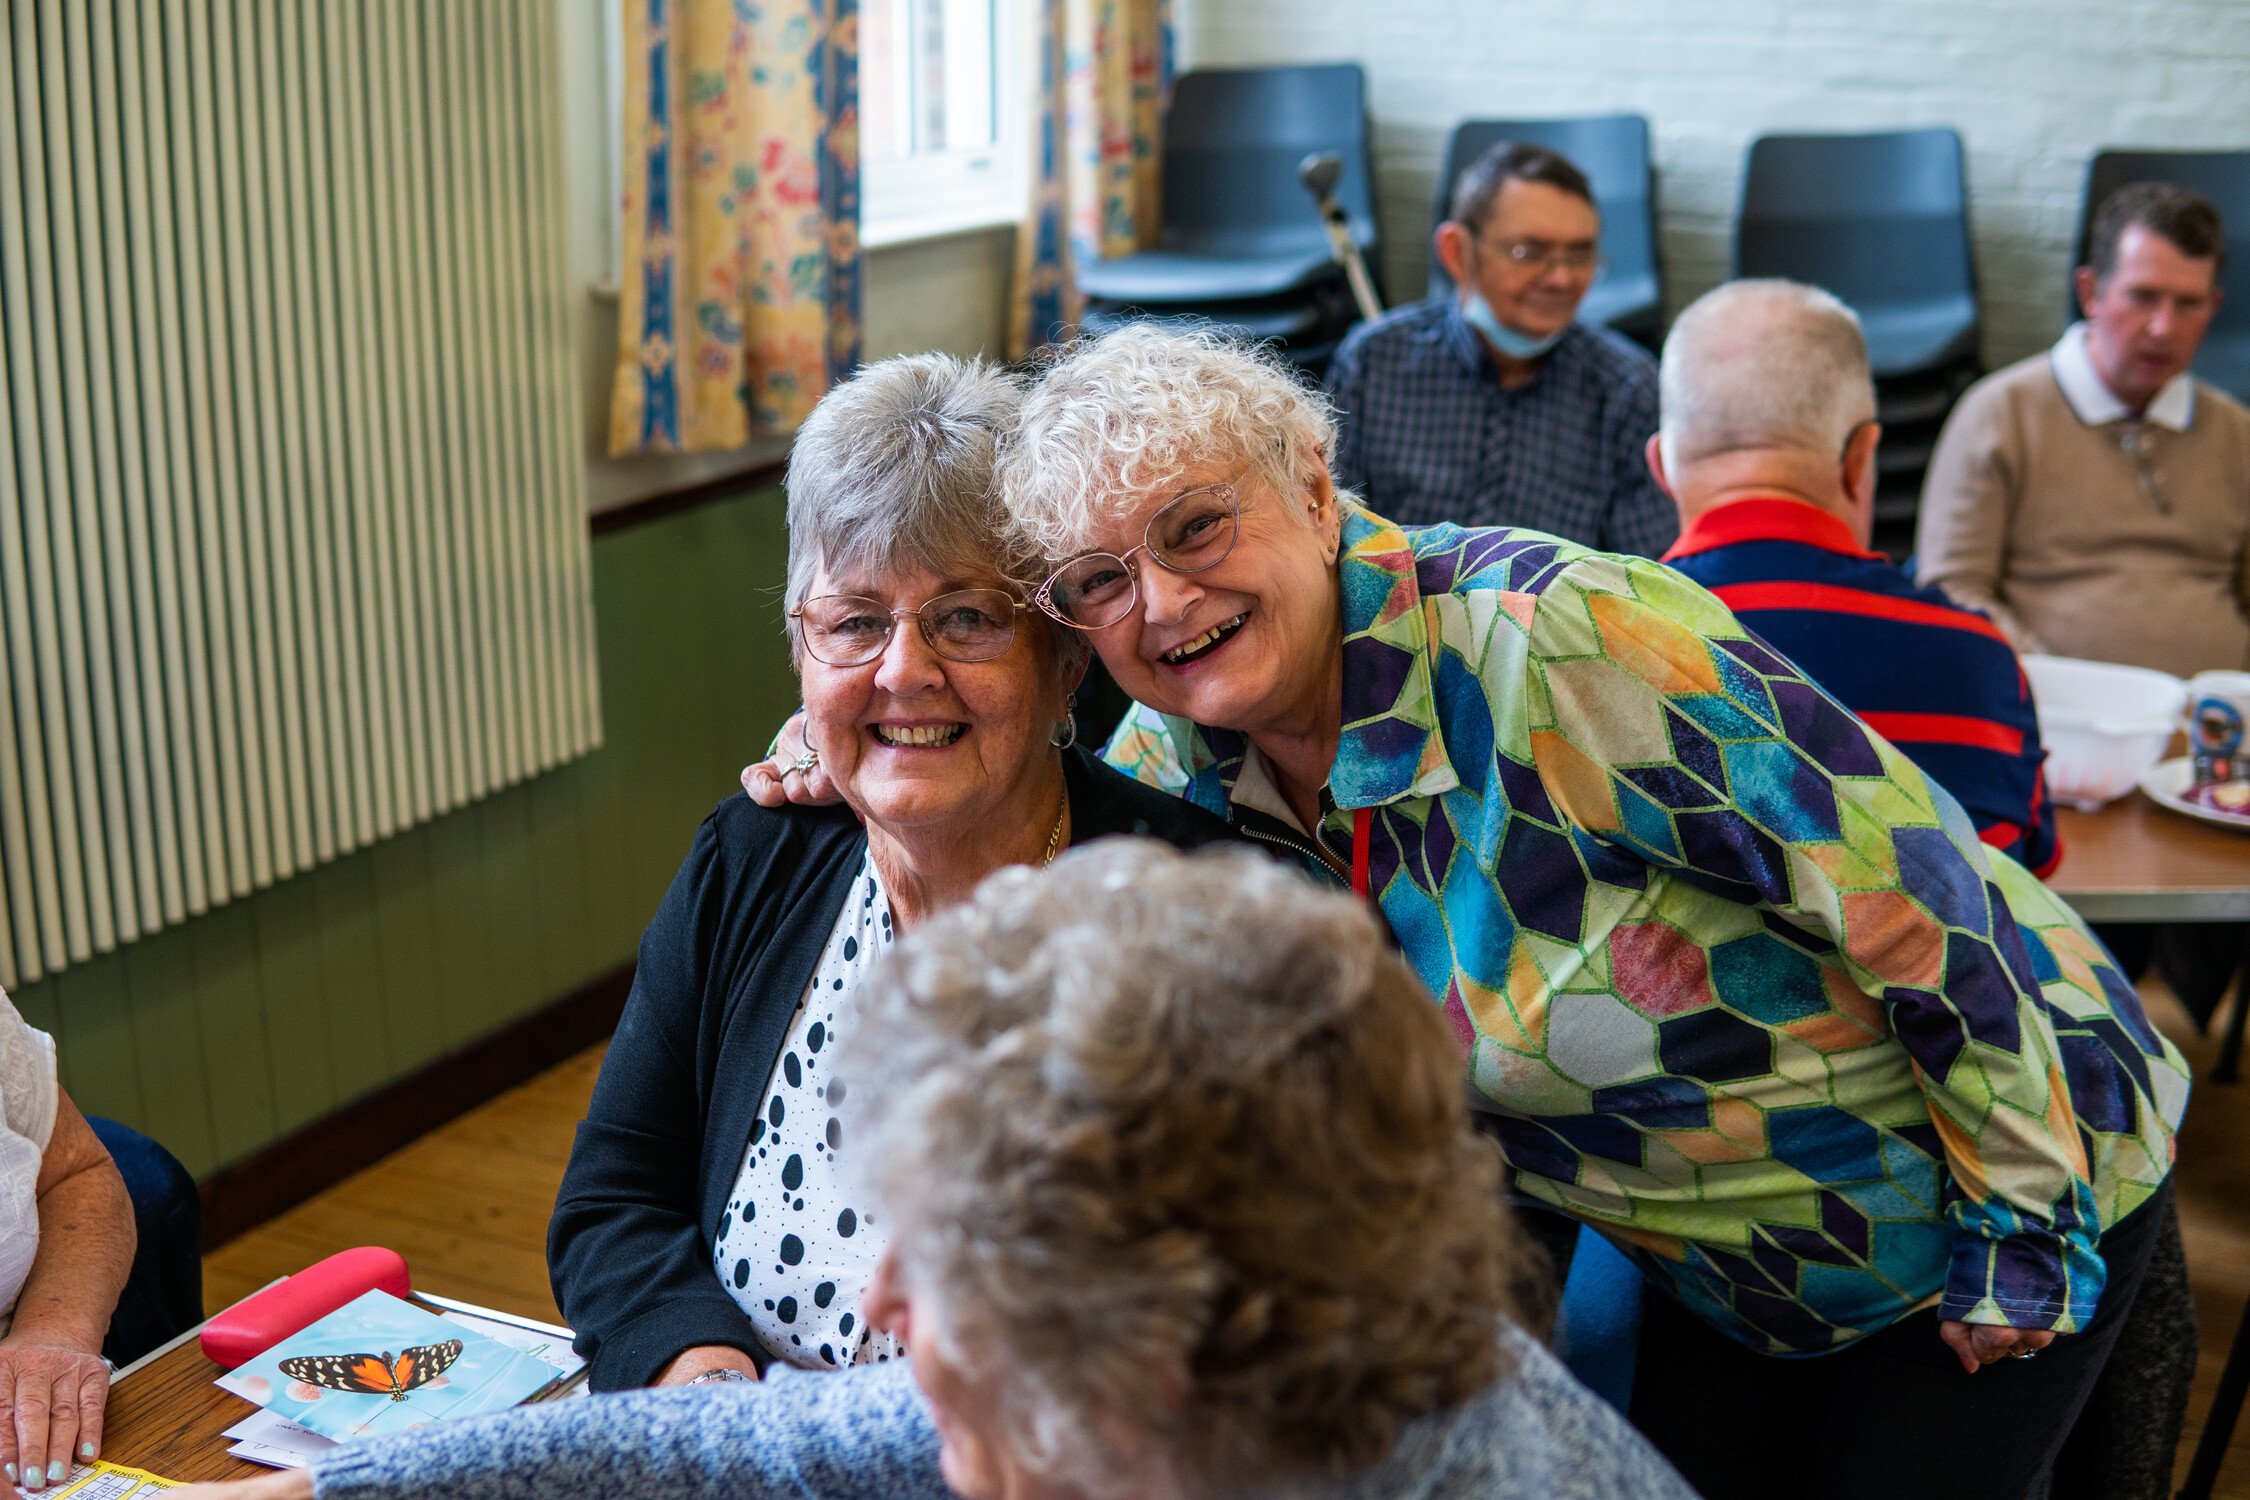
Alongside many other elements that contribute to a good later life are the communities we live in. Being part of a community provides a sense of belonging and support which are vital for psychological wellbeing. Read our blog from our Senior Evidence Manager for Research, Impact and Voice, Aideen Young which outlines our latest State of Ageing chapter.
In our new State of Ageing chapter we show that our communities and neighbourhoods become even more important to us in later life, with older people tending to be more positive than younger people about where they live, and comparatively more older than younger people feeling that they belong and are satisfied with their local areas. And people aged 65 and over are the most likely of all age groups to volunteer and the only age group in which there has been an increase in levels of civic participation.
However, our new analysis of a number of measures on community and neighbourhood from the Community Life Survey finds that not all older people feel equally positive about where they live showing that the inequalities that exist between people across England translate into inequalities between the places where people live.
Ultimately it comes down to poverty and deprivation. Throughout our State of Ageing 2025 report we have highlighted a clear north-south divide – in health, pension provision, employment levels and material deprivation. There are undoubtedly myriad contributing factors, but economics lie at their root, starting with the long-term and far-reaching impact of deindustrialisation in the previously highly industrialised north with long-lasting, knock-on effects on employment levels and the quality of housing.
There is also a significant urban/rural dimension to poverty and deprivation, with local authorities that are largely rural (green dots on chart below) more likely to be less income deprived and those that are largely urban (black dots on chart below) more likely to be more income deprived. In fact, just 5% of local authorities in the poorest fifth are largely rural while 57% are largely urban. Meanwhile, 37% of local authorities in the richest fifth are rural and just 11% are urban. (The concentration of ethnic minority people in specific urban areas through systemic inequalities, housing policies and economic exclusion have played a part in these patterns and we’ll explore this further using forthcoming analysis of Community Life Survey data).
Our data shows that older people living in more income deprived places are less likely to feel positively about where there live: two-thirds (66%) of people aged 50 and over living in urban areas in England feel they belong to their neighbourhood compared with almost three-quarters (73%) in rural areas. While almost everyone in the least deprived areas is satisfied with their local area as a place to live (89%), the proportion is less than two-thirds (62%) in the most deprived areas. And the chart below shows a clear correlation between the proportion of people aged 50 and over who are proud to live in their local area and income deprivation rate.
And the poorest places are caught in a vicious cycle of disadvantage: in 2024/2025, councils’ overall core funding was predicted to be 9% lower in real-terms than in 2010/11 with larger cuts for councils in more deprived than less deprived areas. This is reflected in the fact that of older people in the most deprived areas who don’t feel proud of their area, two-thirds (68%) say it’s because it’s run down, compared with just over a third (35%) in the least deprived areas. And while 81% of people 50 and over living in rural areas who are proud to live there say it’s because it’s safe, this is the case for just 68% in urban areas.
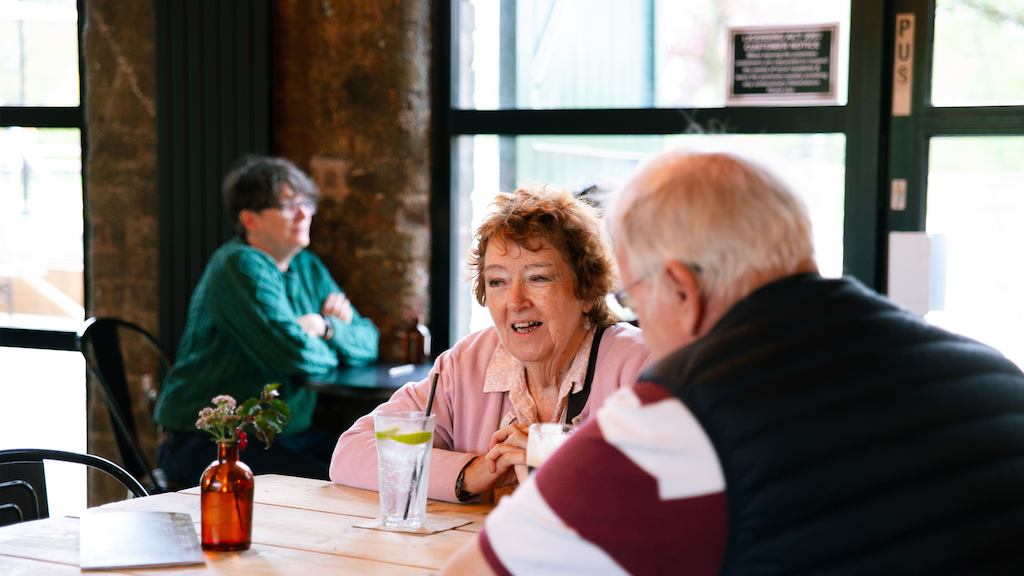
The dissatisfaction came across loud and clear too in our conversations with older people in Middlesbrough and Knowsley, two of the most deprived local authorities in England, where about a quarter of people are living with low income and unable to afford basic necessities. In both places just a little over half of people aged 50 and over say they’re proud to live there (compared with 88% in Richmond upon Thames).
I feel terrible coming down into [Middlesbrough], seeing everything empty. I think 'what a lovely shop that was...
We used to have a bus that used to come on the close every day, ... the ladies, ... they’d go into the town centre shopping, ... so it was keeping a nice community spirit. [Bus company] stopped it so they broke the community.
As we approach later life, we must be able to build strong and supportive relationships across generations and to live in communities that make it easier to stay active and connected. In spite of the challenges some people expressed about Middlesbrough and Knowsley, many also reported a sense of community, and pride in place…one older woman from Knowsley said:
I [feel proud of where I live], and I think that's because the neighbours and the neighbourhood, because everybody kind of looks out for one another, … keeps everywhere clean and tidy.
But overwhelmingly, there was a feeling of loss for the communities they had known in their youth.
It’s vital that local areas recognise the importance of creating places that support people to age well with inclusive opportunities for older people to shape their communities, participate in activities and do the things they enjoy and that matter to them. And that’s why we’re calling on National government to provide every local authority with the resources it needs to become an Age-friendly Community. But the need for action is particularly pressing in the most disadvantaged, often urban areas. This requires targeted, multi-dimensional policy solutions that address immediate needs and entrenched structural inequalities.