A picture's worth a thousand words: What our new set of infographics can tell us about England's ageing population

In this blog our Senior Evidence Manager, Aideen Young, talks about the value of our State of Ageing infographics and how they can facilitate effective and collaborative ways of working.

What is the ‘State of Ageing’?
Our flagship State of Ageing report provides a comprehensive and wide-ranging overview of the latest data and research on our older population in England. The issues it highlights are pressing – an ageing population riven by glaring inequalities in health and financial security with far too many living in unsuitable homes and communities, and unable to find employment because of entrenched ageism.
With data looking at population structure, employment, homes, health, community and financial security, the recommendations included with State of Ageing are wide-ranging – both in their content and the people and organisations for whom they’re intended.
Who are these recommendations for?
There are recommendations directed at national government such as that calling for a Commissioner for Older People and Ageing for England and others directed at local government such as that calling for accessible, safe, walkable neighbourhoods with proper access to basic amenities including seating and toilets and improved public transport.
We’ve called on employers to sign our Age-friendly Employer Pledge to show they recognise the value of older workers and urged research organisations to improve their data collection to enable better understanding of our older population. We even speak directly to individuals asking them to challenge ageism wherever they encounter it.
Why is it important to present this data in different ways?
As such, it is vital that State of Ageing reach the widest possible audience. And that calls for different ways of presenting the data because, of course, not everyone connects with data in the same way. While I love the scatter plots I made for the health chapter, undoubtedly, they make others glaze over and move swiftly on.
Why use infographics?
Even in the most academic of settings there is an increasing appreciation, and use of, visual illustrations for increased research impact. After all, a picture’s worth a thousand words.
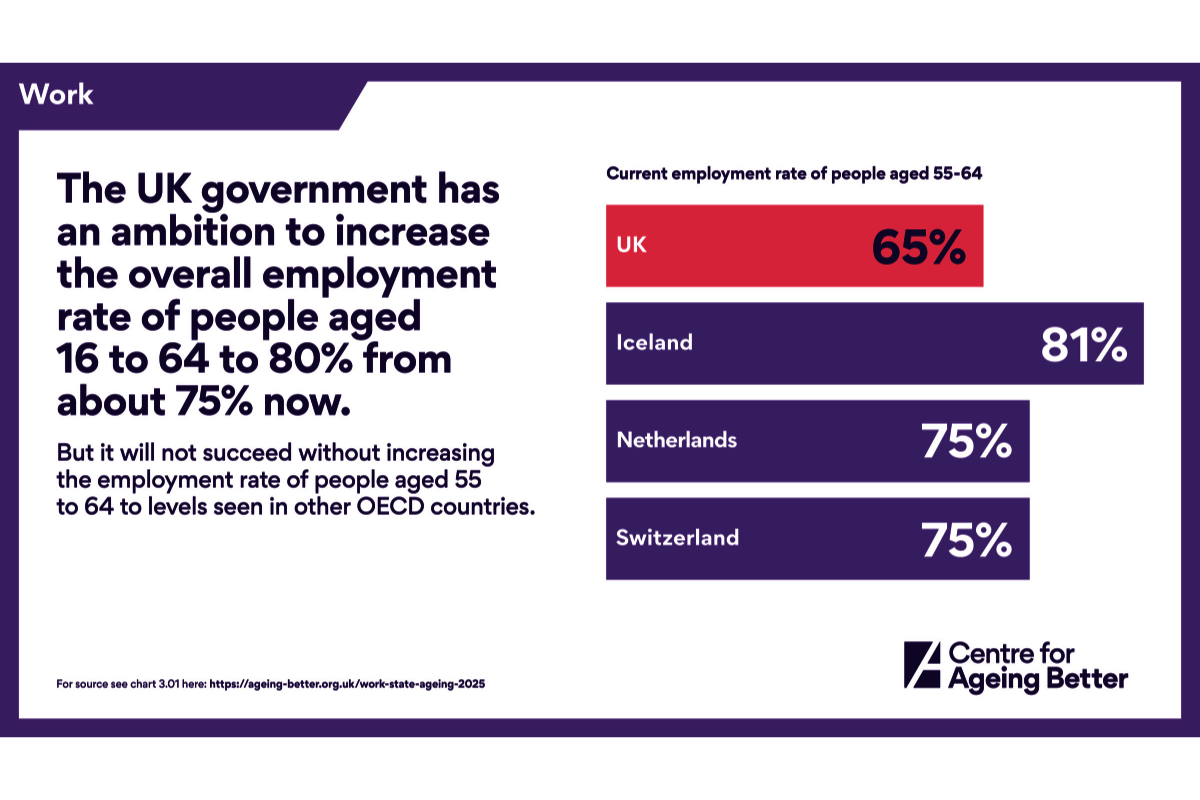
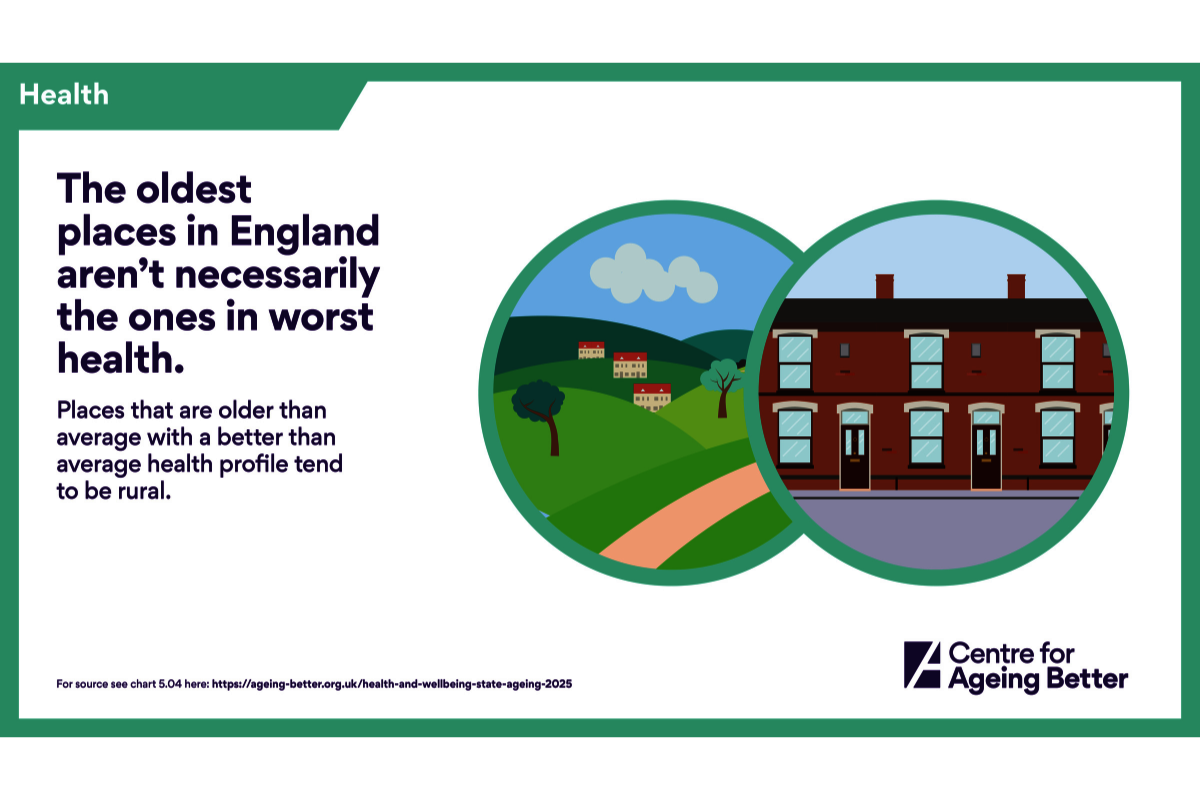
Infographics are data visualizations that convey a message by presenting complex information quickly and clearly. And that’s why we have created this new set of infographics based on data from across State of Ageing 2025 to convey key messages succinctly and in a different style to that used in the main report. Clearly, they serve a purpose: last year's State of Ageing infographics were downloaded more than 1600 times.
This set of illustrations are free to use, and we encourage individuals and organisations to present them digitally or print them out for in-person workshops. We know that State of Ageing is used by a huge range of stakeholders including policy makers, practitioners, academics, third sector, media and voluntary organisations and age-friendly communities.
For instance, it provides a national benchmark for policymakers interested in tracking change in our ageing society and has served as a model for local areas to produce their own State of Ageing reports, guiding local strategies, funding decisions, and service development.
And it has been used with older people themselves; recently for example, it was used to guide conversations with older women from minority ethnic backgrounds about health outcomes in their community with a view to co-producing solutions that included developing health champions.
Here's what one of our stakeholders said about using our infographics:
"The infographic approach used at Ageing Better effectively distils important information into an accessible, relatable format. The visuals are immediate, clear, and compelling- presenting factual data in a way that feels neither dry nor alarmist.
"The friendly style, thoughtful representation of the UK population, and smart, consistent use of colour all work together to create an engaging experience, which feels legible rather than reductive and empowering rather than depressing. All in all they are an effective call to action for pressing issues that affect us all."
Shamita Sharmacharja, Curator, Wellcome Collection
Ensuring that everyone can engage with the opportunities and challenges associated with our ageing population
We believe that this heterogeneity of uses is possible because we convey this rich, and often complex data in a variety of ways: narrative, graphs, quotes, and now these infographics. Ultimately, this is about respect — respect for the complexity and importance of the issue, and respect for the diversity of the people who need to understand it.
Some will skim, some will dive deep, some will want the headline, and some will want the detail.
By offering multiple entry points, we make sure the story of ageing is heard, understood, and ultimately acted upon.